What would you consider decent, fast, world class, etc. on 3x3?

just for fun here is what i think about other events

4x4
1:15, 1:00, 50, 35, 30
5x5
2:15, 1:45, 1:30, 1:15, 1:00
mega
2:00, 1:30, 1:10, 1:00, 50
6x6
4:00, 3:20, 2:50, 2:15, 2:00
7x7
6:00, 4:30, 3:50, 3:15, 2:55

Umm... 3 people in the world have a sub-1 5x5 average. That is way too strict for world class IMO
 
Once you get fast, you realize how slow you were. That accounts for the "harshness"


I don't think I would have answered much differently if I was sub-8, maybe i'd say sub 20 is decent rather than sub 25.
Im sure that less than 10% of cubers reach sub 15. (albeit almost anyone could achieve it imo)
I generally think this though
beginner: sup 30
intermediate 15-30
advanced 9-15
elite sub 9
 

Boo uneven bar widths

Your correlations are really interesting though. Kind of wish that this survey asked for their PB on 3x3 -- that would be a really interesting variable to correlate this with.

EDIT: Actually, now that I think about it, these kind of have to be correlated by nature since the responses all have to be decreasing, so this really doesn't say anything interesting. Again, would be interesting to see correlations with 3x3 average -- would expect that as the average improves, the times people specify for each class would be lower as well.
 
Last edited:
i put 20/15/12/10/8.

some people here need to check their estimations.... google "Dunning-Kruger effect".

With my numbers, although 20 seconds is enourmously fast relative to the average human, i went with practice time needed, where you just get sub20 by brainlessly cubing for some months or in 1-2 months with focused practice. for 12/10/8 seconds you have to put in a HUGE amount of practice time, exponentionally increasing.

Are cubes and methods so good now that this is all it takes to be sub-20? Or do all the people you know get sub-20 quickly and you're extrapolating that out to the whole cubing community? I'm not being sarcastic, I'm really asking.
 
Are cubes and methods so good now that this is all it takes to be sub-20? Or do all the people you know get sub-20 quickly and you're extrapolating that out to the whole cubing community? I'm not being sarcastic, I'm really asking.

Cubes and methods are good enough. I'd say if you manage to put in 1-2 hours of focused practice daily, you will manage to be sub20 within two months , no matter your age, intelligence or dexterity.

I could be extrapolating, especially since I only know cubers of a very limited age group, but I wouldn't know it and I doubt it.
 
Last edited:
Boo uneven bar widths

Your correlations are really interesting though. Kind of wish that this survey asked for their PB on 3x3 -- that would be a really interesting variable to correlate this with.

EDIT: Actually, now that I think about it, these kind of have to be correlated by nature since the responses all have to be decreasing, so this really doesn't say anything interesting. Again, would be interesting to see correlations with 3x3 average -- would expect that as the average improves, the times people specify for each class would be lower as well.

The bar widths to me just made logical sense. I did think about them being unequal (just didn't care).

As for the correlations, logically they would be: I posted them because some of them were remarkable low.
 
The bar widths to me just made logical sense. I did think about them being unequal (just didn't care).

As for the correlations, logically they would be: I posted them because some of them were remarkable low.

Hard to say they are remarkably low without some sort of test or baseline -- what would you expect the correlations to be, and what circumstance led you to think that? The ones that are low are likely that way just because they are farthest apart on the decreasing scale, and thus don't have as strong of a relationship. It also doesn't help that the standard deviations are vastly different -- the small range of world class values can make it difficult to detect a relationship.

And yeah, a bit nitpicky on the "density curve" -- I just was hoping to have a good way to view the skewness, and uneven bar widths prevent me from visually seeing that. It's also just something that's generally frowned upon as it is an indication that something is intentionally being hidden, although I definitely believe that you were not doing that.
 
Cubes and methods are good enough. I'd say if you manage to put in 1-2 hours of focused practice daily, you will manage to be sub20 within two months , no matter your age, intelligence or dexterity.

I could be extrapolating, especially since I only know cubers of a very limited age group, but I wouldn't know it and I doubt it.

Wow, that is unreal. So the percentage of people who spend 60-120 hours learning modern methods, practicing with a good speedcube, and who are not sub-20 is quite small, then?

Why do you think there are people nowadays who have cubed for years and are not yet consistently sub-20? If it's so easy, then why do such people exist? What could they be doing that is SO wrong that they haven't achieved this seemingly beginner level of skill yet?
 
Cubes and methods are good enough. I'd say if you manage to put in 1-2 hours of focused practice daily, you will manage to be sub20 within two months , no matter your age, intelligence or dexterity.

I could be extrapolating, especially since I only know cubers of a very limited age group, but I wouldn't know it and I doubt it.

I think that you are over exaggerating how easy it is to get sub 20. 1-2 months is not enough to be sub 20, unless you practice for many hours a day(way more than 1-2). Most people take 6+ months to get to be sub-20. People who are sub-20 in 1-2 months are usually commended for their extraordinary improvement.
 
Hard to say they are remarkably low without some sort of test or baseline -- what would you expect the correlations to be, and what circumstance led you to think that? The ones that are low are likely that way just because they are farthest apart on the decreasing scale, and thus don't have as strong of a relationship. It also doesn't help that the standard deviations are vastly different -- the small range of world class values can make it difficult to detect a relationship.

And yeah, a bit nitpicky on the "density curve" -- I just was hoping to have a good way to view the skewness, and uneven bar widths prevent me from visually seeing that. It's also just something that's generally frowned upon as it is an indication that something is intentionally being hidden, although I definitely believe that you were not doing that.

With the most recent data (I just updated it a minute ago), the correlation between decent and world class is only .172. Using this, you can adjust the slider. A correlation of .172 is little more than a blob. Even between fast and world class is .422, which is where it gets closer to what I would expect. With what would seem like it should be the closest, really fast and world class, there's a definitive trend, but not as close as I would expect.

As for the curve, I completely understand that it's an easy way to obscure data. Obviously there's nothing to hide, I've updated it with a wider, 4 second increment.
 
I think that you are over exaggerating how easy it is to get sub 20. 1-2 months is not enough to be sub 20, unless you practice for many hours a day(way more than 1-2). Most people take 6+ months to get to be sub-20. People who are sub-20 in 1-2 months are usually commended for their extraordinary improvement.

yup, only people I know of are pdf and feliks. it took me 8 months
 
With the most recent data (I just updated it a minute ago), the correlation between decent and world class is only .172. Using this, you can adjust the slider. A correlation of .172 is little more than a blob. Even between fast and world class is .422, which is where it gets closer to what I would expect. With what would seem like it should be the closest, really fast and world class, there's a definitive trend, but not as close as I would expect.

As for the curve, I completely understand that it's an easy way to obscure data. Obviously there's nothing to hide, I've updated it with a wider, 4 second increment.

Yes, I understand what correlation is, I did my Master's in stats. :P The purpose of that question was not to ask you what you would expect it to look like, but what value would you actually expect, and why you would expect it based on your assumptions.

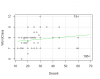
It would indeed be surprising if the data did look like that generic blob, but our data isn't necessarily that generic (unless you skew the axes). Here, it's just because the range of world class times is so low (4) that the covariance cannot detect these differences well, and then dividing this by the high standard deviation of the lower class times results in a very low correlation. See this scatterplot:

mHySUs8.png


Note that every value is between 6 and 10, and most responses are integer values -- thus, all of those 8s are within a couple tenths from the mean, hence resulting in a large portion of the points contributing next to nothing to the covariance.

You also can see that due to these two variables being so far apart within the monotonic structure of the variables, that the "decent" level has about 5 very high responses, with some lower responses near 20-30 as well. If you consider that those 5 people had a completely different idea of what "decent" means than the rest of those surveyed and consider them outliers, the correlation would actually increase quite a bit -- good empirical evidence of how Pearson correlation is incredibly sensitive to outliers.

EDIT: I also noticed that one of the points was clearly a joke time, with "decent" being 69 and "world class" being 6.25 -- removing that point alone brings up the correlation to 0.263.
 

Attachments

  • mHySUs8.png
    mHySUs8.png
    5.8 KB · Views: 10
Yes, I understand what correlation is, I did my Master's in stats. :P The purpose of that question was not to ask you what you would expect it to look like, but what value would you actually expect, and why you would expect it based on your assumptions.

It would indeed be surprising if the data did look like that generic blob, but our data isn't necessarily that generic (unless you skew the axes). Here, it's just because the range of world class times is so low (4) that the covariance cannot detect these differences well, and then dividing this by the high standard deviation of the lower class times results in a very low correlation. See this scatterplot:

http://i.imgur.com/mHySUs8.png

Note that every value is between 6 and 10, and most responses are integer values -- thus, all of those 8s are within a couple tenths from the mean, hence resulting in a large portion of the points contributing next to nothing to the covariance.

You also can see that due to these two variables being so far apart within the monotonic structure of the variables, that the "decent" level has about 5 very high responses, with some lower responses near 20-30 as well. If you consider that those 5 people had a completely different idea of what "decent" means than the rest of those surveyed and consider them outliers, the correlation would actually increase quite a bit -- good empirical evidence of how Pearson correlation is incredibly sensitive to outliers.

EDIT: I also noticed that one of the points was clearly a joke time, with "decent" being 69 and "world class" being 6.25 -- removing that point alone brings up the correlation to 0.263.

Hmm...didn't consider the low range (and relatively high step) along the various data points. That definitely makes a difference.

I did consider removing the row with 69, 42, 13.37 due to the obvious references. I'll definitely do that, and see how things turn out if I remove (not really remove, but remove from the stat) any person that put "decent" as >50. That'll come later though, as I'm leaving in a couple minutes.
 
Back
Top