Yes, I understand what correlation is, I did my Master's in stats.

The purpose of that question was not to ask you what you would expect it to look like, but what value would you actually expect, and why you would expect it based on your assumptions.
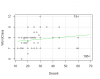
It would indeed be surprising if the data did look like that generic blob, but our data isn't necessarily that generic (unless you skew the axes). Here, it's just because the range of world class times is so low (4) that the covariance cannot detect these differences well, and then dividing this by the high standard deviation of the lower class times results in a very low correlation. See this scatterplot:
http://i.imgur.com/mHySUs8.png
Note that every value is between 6 and 10, and most responses are integer values -- thus, all of those 8s are within a couple tenths from the mean, hence resulting in a large portion of the points contributing next to nothing to the covariance.
You also can see that due to these two variables being so far apart within the monotonic structure of the variables, that the "decent" level has about 5 very high responses, with some lower responses near 20-30 as well. If you consider that those 5 people had a completely different idea of what "decent" means than the rest of those surveyed and consider them outliers, the correlation would actually increase quite a bit -- good empirical evidence of how Pearson correlation is incredibly sensitive to outliers.
EDIT: I also noticed that one of the points was clearly a joke time, with "decent" being 69 and "world class" being 6.25 -- removing that point alone brings up the correlation to 0.263.