3x3x3 WCA avg. times for everybody with <= 150s.

JohanAR

Regular
Joined
Apr 5, 2013
Messages
37
Location
Sweden
WCA ID
2013RAST02
I made a histogram of all registered average times from World Cube Association as of 2013-04-14. There are probably better ways to represent this data but I've never used matplotlib before and it was late. Sharing in case anyone else finds this interesting. If anyone desperately wants a graph of some other cube size or single times I might be able to make it.

SHtY1gc.png
 
Last edited by a moderator:
Nice graph by the way. It sort of motivates me to get faster so I won't be in the majority haha[/QUOTE]

Or get slower...
 
So, with an official average of 19.40, Im very normal :(
Then it's time to get sub 15 soon to get out of that group :P
 
I think it's the number of people.

Correct. However, I think the width of each bar is quite unscientific.. IIRC I just told matplotlib to divide the data into 1000 groups (not all visible since I cut the xaxis at 150s). If I figure out how, I might change it so that each bar is 1s wide.

Awesome graph :) If it's not too much work, you should do 4x4 and 5x5 too!

I'll update the Python script so that you don't have to manually cut out the table, then I'll post those graphs and the script too if anyone wants to play around with it. Just don't expect too much user friendliness :)

It would be interesting to see the same graph from 5 years ago to see how things have changed.

Since that information is available on WCA's page it would be quite trivial to graph it. I'll see if I can draw both that one and the current times in the same plot.
 
Last edited:
This is of average times though. People who started when they averaged a minute and have just now gotten to the sub-20 or sub-15 marker will have their speed be ill-represented.

It shows people's best average from any WCA competition, so it's not an average over a person's career.

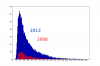
Here are the requested plots:

3x3 average 2013 vs 2008
attachment.php

avg_times_2008_2013_combined.png

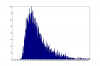
4x4 average
attachment.php

avg_times4_2013.png

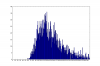
5x5 average
attachment.php

avg_times5_2013.png

The last two look a bit wonky because of larger time interval and fewer registered times.

Here's the short script I've used to generate them. You have to look at the records page source and delete everything the lines with table data. Expect zero user-friendliness and no support :)

Code:
f = open('events.htm')
ls = f.readlines()
f.close()

def tim(st):
    b=st.find('class=\'R2\'>')+11
    e=st.find('<',b)
    c=st[b:e].find(':')
    if c >= 0:
        return 60*int(st[b:b+c]) + float(st[b+c+1:e])
    else:
        return float(st[b:e])

ts = map(tim, ls)

import matplotlib
matplotlib.use('Agg')
from matplotlib import pyplot
pyplot.figure(figsize=(12, 8), dpi=100)

xmax = 200

pyplot.hist(ts, bins=xmax, range=(0, xmax))
pyplot.xticks(range(0,xmax,10))
pyplot.yticks(range(0,800,100))
pyplot.savefig('avg_times.png')
 
I'll see what I can do.. I merged those graphs with GIMP so it's a little bit more work, and I might need to adjust some parameters to get something better for low number of samples. Doing 2x2 and OH too.
 
imo it would also be interesting to merge the 2013 and 2008 graphs by standardising one of them so it matches the highest point of the other. do you know what i mean? by that it would be easier to see how much the community has improved.
 
Back
Top