JohanAR
Regular
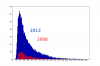
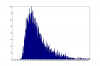
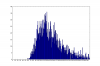
I made a histogram of all registered average times from World Cube Association as of 2013-04-14. There are probably better ways to represent this data but I've never used matplotlib before and it was late. Sharing in case anyone else finds this interesting. If anyone desperately wants a graph of some other cube size or single times I might be able to make it.

Last edited by a moderator: