

BlackStahli
Regular
So in the past, I've seen quite a lot of people ask if a certain average or something makes them sub-x, such as "I have a 24.97 average of 12, does that make me sub-25?", and the like. This occurrence leads me to believe even more strongly that statistics should be as, if not more, important than algebra, and that concepts such as standard deviation and normal distribution should be as well-known as solving for x or finding the slope of a line.
But anyhow, if you don't know much about statistics, the following is a crash-course on the part you need to know to tell if you are sub-x. If you don't want to read it, feel free to skip to the link below.
Whenever you have a collection of data, there are multiple ways to describe it. You can take the sum and divide it by the number of elements, which gives the arithmetic mean. You can order them from lowest to greatest and find the middle value, which is the median.
One term that most people probably aren't familiar with is "standard deviation". You know in qqtimer what the σ means? The thing that looks like an o and is next to the averages of 5, 12, and 100? That is the standard deviation. You get the standard deviation of a collection of data by taking the sum of the square of the difference of each value from the mean, divide that by the number of elements, and take its square root. That is the standard deviation, and that is the most common way of assessing how widely spread out a collection of data is. If you have a big standard deviation, your times are really inconsistent, and if you have a small standard deviation, your times are really consistent.
Now, you might be thinking, what does this have to do with determining if I'm sub-x?
If you use a timer like prisma or something, you might remember that you can see your times graphed in a histogram, which is pretty much like a bar graph. Assuming that you have a really large number of solves, hence a large number of bars, a graph of your times may look something like the following:
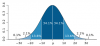
That is the normal distribution. However, because you probably usually do average of 12 or 25, a histogram of that session may not look like it at all. Thus, it is common among statisticians to assume that you need at least 30 data values in the collection to assume a normal distribution. So, if you want to tell if you're sub-x, make sure you do at least an average of 30, such 50 or 100.
The meaning of the graph is a distribution of percent chance that, if you pick a data value from your collection of data randomly, it will be in that range. The graph is centered at the mean of your data, and each separation is by one standard error of mean, which is standard deviation divided by the square root of the number of elements. So, for example, if your average of 50 has a mean of 25 seconds and a standard deviation of 2 seconds, there is a 34.1% chance that a randomly selected solve from your session will land in the range of 25-25.28 seconds. (2/rt(50) is about 0.28)
Ah, and here is where it gets tricky.
As you might see, past 3 standard deviations is where the likelihood of choosing a solve in that range goes down dramatically (0.1% for 3 standard deviations and beyond). So, in the above case, you can say that there is a 99.9% chance that you're sub-25.85 (25 + 3*.28). 99.9% chance obviously has really high validity in its implications, however statisticians commonly use an established value of 0.05/5% (also called alpha), which is the highest acceptable probability before you can make a valid claim. So, in this case, there is a 95% chance that you can be sub-25.47.
In statistics, there's this thing called a hypothesis test where you can test whether a collection of data is below or above or both a certain value. It involves everything that I described above. I won't go into any more detail on this subject, but that's pretty much what you need to know.
And the moment you've been waiting for... (or if you're skipped the above)
http://easycalculation.com/statistics/hypothesis-test-population-mean.php
The link directs you to an online hypothesis test calculator. Here's what you need to input:
- one-tailed test, since you only want to see if you're sub-x, not sub/sup-x
- sample mean = mean of your average
- population mean = if you want to see if you're sub-x, then this is x
- sample standard deviation = your standard deviation (yeah, there is a difference between population and sample standard deviation, but typically they don't differ much and don't really change much here)
- population size = number of solves in the session
And then hit calculate! It should give you a t-score and a p-value. Ignore the t-score if you don't know what it means, but you should be looking at the p-value. Depending on what you think is significant (which usually is 0.05), that value tells you the probability that your claim is wrong. So, obviously, the lower the better!
For example, if you have a 19.62 average of 100 with a standard deviation of 1.59 and you want to see if you're sub-20, you should get a p-value of 0.0084, meaning that there is a 0.84% chance that you aren't sub-20.
Sorry if this is misleading or hard to comprehend, I just wrote this on a whim
But anyhow, if you don't know much about statistics, the following is a crash-course on the part you need to know to tell if you are sub-x. If you don't want to read it, feel free to skip to the link below.
Whenever you have a collection of data, there are multiple ways to describe it. You can take the sum and divide it by the number of elements, which gives the arithmetic mean. You can order them from lowest to greatest and find the middle value, which is the median.
One term that most people probably aren't familiar with is "standard deviation". You know in qqtimer what the σ means? The thing that looks like an o and is next to the averages of 5, 12, and 100? That is the standard deviation. You get the standard deviation of a collection of data by taking the sum of the square of the difference of each value from the mean, divide that by the number of elements, and take its square root. That is the standard deviation, and that is the most common way of assessing how widely spread out a collection of data is. If you have a big standard deviation, your times are really inconsistent, and if you have a small standard deviation, your times are really consistent.
Now, you might be thinking, what does this have to do with determining if I'm sub-x?
If you use a timer like prisma or something, you might remember that you can see your times graphed in a histogram, which is pretty much like a bar graph. Assuming that you have a really large number of solves, hence a large number of bars, a graph of your times may look something like the following:
That is the normal distribution. However, because you probably usually do average of 12 or 25, a histogram of that session may not look like it at all. Thus, it is common among statisticians to assume that you need at least 30 data values in the collection to assume a normal distribution. So, if you want to tell if you're sub-x, make sure you do at least an average of 30, such 50 or 100.
The meaning of the graph is a distribution of percent chance that, if you pick a data value from your collection of data randomly, it will be in that range. The graph is centered at the mean of your data, and each separation is by one standard error of mean, which is standard deviation divided by the square root of the number of elements. So, for example, if your average of 50 has a mean of 25 seconds and a standard deviation of 2 seconds, there is a 34.1% chance that a randomly selected solve from your session will land in the range of 25-25.28 seconds. (2/rt(50) is about 0.28)
Ah, and here is where it gets tricky.
As you might see, past 3 standard deviations is where the likelihood of choosing a solve in that range goes down dramatically (0.1% for 3 standard deviations and beyond). So, in the above case, you can say that there is a 99.9% chance that you're sub-25.85 (25 + 3*.28). 99.9% chance obviously has really high validity in its implications, however statisticians commonly use an established value of 0.05/5% (also called alpha), which is the highest acceptable probability before you can make a valid claim. So, in this case, there is a 95% chance that you can be sub-25.47.
In statistics, there's this thing called a hypothesis test where you can test whether a collection of data is below or above or both a certain value. It involves everything that I described above. I won't go into any more detail on this subject, but that's pretty much what you need to know.
And the moment you've been waiting for... (or if you're skipped the above)
http://easycalculation.com/statistics/hypothesis-test-population-mean.php
The link directs you to an online hypothesis test calculator. Here's what you need to input:
- one-tailed test, since you only want to see if you're sub-x, not sub/sup-x
- sample mean = mean of your average
- population mean = if you want to see if you're sub-x, then this is x
- sample standard deviation = your standard deviation (yeah, there is a difference between population and sample standard deviation, but typically they don't differ much and don't really change much here)
- population size = number of solves in the session
And then hit calculate! It should give you a t-score and a p-value. Ignore the t-score if you don't know what it means, but you should be looking at the p-value. Depending on what you think is significant (which usually is 0.05), that value tells you the probability that your claim is wrong. So, obviously, the lower the better!
For example, if you have a 19.62 average of 100 with a standard deviation of 1.59 and you want to see if you're sub-20, you should get a p-value of 0.0084, meaning that there is a 0.84% chance that you aren't sub-20.
Sorry if this is misleading or hard to comprehend, I just wrote this on a whim


